
Most Park City Rentals Are Underperforming Even When They Look Successful
If your Park City vacation rental is consistently booked, you may still be underperforming by 20 - 40% annually often $75K–$150K+ in missed revenue.
The average Park City vacation rental income varies widely by submarket, but most properties generate between $70K and $ 600K annually. The difference between average and top-performing rentals is almost always pricing execution, not demand.
This market does not have a demand problem. It has a pricing execution problem.
What High-Performing Park City Rentals Get Right
• High occupancy is often a sign of underpricing—not success
• A small number of peak weeks drive a disproportionate share of revenue
• Missing pricing windows (holidays, ski season peaks) create six-figure gaps
• Shoulder season strategy determines whether revenue stabilizes or drops
• Revenue optimization not bookings is the real performance metric
Why Most Park City Rentals Underperform
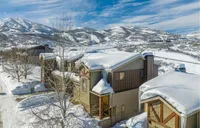
Park City remains one of the most supply-constrained, high-demand luxury rental markets in the U.S., driven by:
• Winter ski tourism
• Holiday travel demand
• Summer outdoor tourism
• Luxury second-home ownership
Even with the Sundance Film Festival no longer in Park City after 2026, demand remains strong, but pricing complexity has increased.
Most underperformance comes down to one issue:
Pricing Strategy Failure
Not demand.
Not the property.
Not the location.
The Three Core Failures
• Static pricing in a dynamic market
• Prioritizing occupancy over ADR
• Failing to capitalize on compression windows
Park City Submarket Benchmarks: What You Should Be Earning
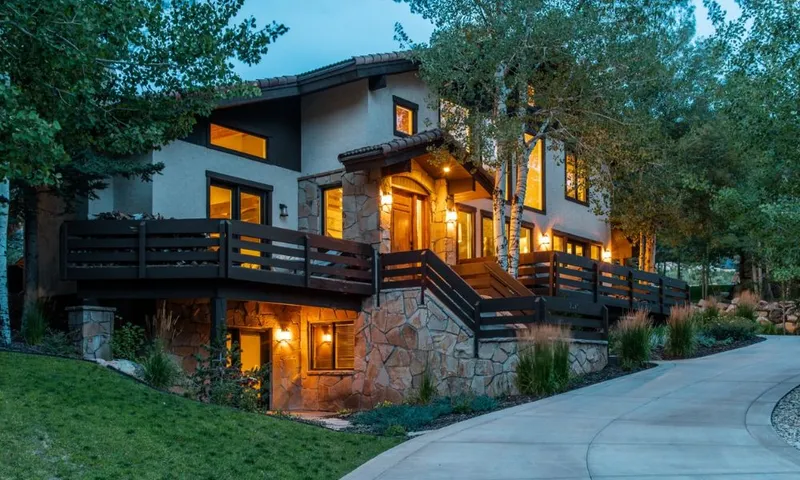
Deer Valley (Luxury, Ski-In/Ski-Out Premium)
• Annual Revenue: $250K–$600K+
• Peak ADR: $2,000–$8,000+
• Occupancy: 50–65%
Why it outperforms:
Ski-in/ski-out access creates premium pricing power.
Underperformance trigger:
If your peak winter rates are not exceeding $5K–$8K+, revenue is being left behind.
Old Town (Walkability + Year-Round Demand)
• Annual Revenue: $120K–$250K
• Peak ADR: $800–$2,500
• Occupancy: 60–75%
Why it outperforms:
Walkability to Main Street drives both winter and summer demand.
Underperformance trigger:
Flat weekend pricing during high-demand periods.
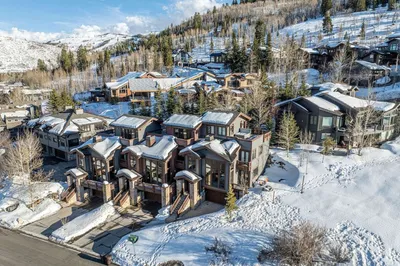
Canyons Village (Occupancy Strength, ADR Risk)
• Peak ADR: $400–$1,200
• Annual Revenue: $70K–$150K
• Occupancy: 65–80%
Why it outperforms:
Consistent family demand and resort infrastructure.
Underperformance trigger:
High occupancy with stagnant ADR = underpricing.
Jordanelle (Emerging Growth + Mispriced Inventory)
• Annual Revenue: $90K–$220K
• Peak ADR: $500–$1,800
• Occupancy: 50–70%
Why it outperforms:
Expansion of Deer Valley and new luxury inventory.
Underperformance trigger:
Pricing below comparable areas due to outdated assumptions.
How to Diagnose Underperformance Immediately
If any of the following are true, your property is underperforming:
Revenue Signals
• You are fully booked for peak winter dates months in advance
• Your annual revenue has plateaued or grown slowly
• Comparable properties are outperforming you
Pricing Signals
• Your rates do not change meaningfully week-to-week
• You discount early to secure bookings
• You are not adjusting pricing based on booking pace
Behavioral Signals
• You measure success by occupancy
• Your manager uses static or infrequent pricing updates
• You are not benchmarking against your submarket

Where Revenue Is Actually Being Lost
Holiday Compression Failure (Christmas & New Year)
This is the highest-value period of the year.
Common mistake:
• Booking early at conservative rates
Reality:
• Rates should increase aggressively as inventory tightens
Missed revenue: $20K–$80K+ in just two weeks
February Ski Demand Mispricing
February consistently delivers:
• Peak snow conditions
• High family travel demand
• Longer stays
Common failure:
• Treating February like early January
Missed revenue: $25K–$75K+
Peak Weekend Underpricing
Even without Sundance, Park City experiences:
• High-demand ski weekends
• Event-driven compression
• Late booking surges
Failure:
• Locking in rates too early
Shoulder Season Mispricing
Spring and fall require precision, not blanket discounts.
Common mistakes:
• Overpricing → low occupancy
• Underpricing → weak ADR
What Optimized Park City Rentals Do Differently
Revenue-First Pricing Strategy
• Optimize for ADR, not occupancy
• Accept vacancy to capture higher-value bookings
• Avoid early discounting
Peak Period Maximization
• Holiday and ski peaks are aggressively priced
• February is treated as a premium window
• Pricing increases as demand builds
Booking Window Control
• Early bookings secured at strong rates
• Mid-window adjustments based on pace
• Late-stage optimization captures remaining demand
Micro-Location Strategy
• Ski-in/ski-out commands major ADR premiums
• Walkability in Old Town increases year-round revenue
• Jordanelle requires forward-looking pricing strategy
The Moment Most Owners Miss
If your property is generating:
• $150K → potential is $200K+
• $250K → potential is $325K+
• $400K → potential is $500K+
That difference is not theoretical. It exists within your direct comp set in Park City. And it is being captured by better-executed properties.
The Real Cost of Underperformance
• 20% gap → $40K–$120K annually
• 40% gap → $75K–$150K+ annually
Over five years:
• $200K–$750K+ in lost income
This is not a market limitation. It is an execution gap.
Frequently Asked Questions
Does high occupancy mean my rental is performing well?
No. In Park City, high occupancy often indicates missed pricing opportunities.
What matters more: ADR or occupancy?
ADR. Revenue is driven by pricing precision during peak demand.
How has demand changed after Sundance left Park City?
Demand remains strong, but pricing now relies more heavily on holiday and ski compression periods.
What is the average Park City vacation rental income?
Most properties generate between $70K and $600K+ annually, depending on location, size, and ski access.
Why do similar homes earn different revenue?
Because of:
• Pricing strategy
• Booking timing
• Distribution exposure
• Management execution
Related Park City Owner Insights
• Park City vacation rental income potential
• Deer Valley vacation rental income benchmarks
• Old Town vs Canyons Village rental performance
• Best Park City property management strategies

Final Reality for Park City Owners
If your Park City rental is:
• Frequently booked
• Consistently occupied
• Generating “solid” income
…it may still be underperforming by 20–40%.
In this market:
• Demand already exists
• Location already matters
The difference is execution.
You are either:
• Maximizing your revenue potential
or
• Losing six figures every year without realizing it