
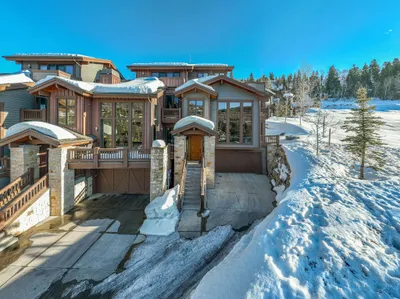
Most Park City Rentals Are Underperforming. Here is How to Know
Most Park City vacation rentals underperform by 20 to 40 percent due to incorrect pricing, weak positioning, and outdated management strategies across Deer Valley, Old Town, Canyons Village, and Jordanelle.
Many owners do not recognize the gap because they are not comparing performance against real submarket benchmarks. To understand how your property compares, review our Park City vacation rental income benchmarks.
- Many Park City owners are leaving 20 to 40 percent of potential revenue on the table
- Underperformance is driven by execution, not demand
- Submarket differences materially impact results
What This Means:
Most Park City rentals are not underperforming because of the market. They are underperforming because of execution.
What Doing Nothing Actually Costs
If your property is underperforming by 20 to 40 percent, the financial impact compounds quickly.
- 50K per year equals 250K over five years
- 100K per year equals 500K over five years
- 200K per year equals 1M or more over five years
The Reality:
Underperformance is not a short term issue. It compounds into meaningful long term loss.
You Could Be Losing 50K to 300K Per Year Without Knowing It
Most Park City rentals underperform due to poor pricing, low visibility, and misaligned strategy for their submarket.
Your property is likely affected if:
- Your occupancy feels acceptable but revenue is flat
- Your ADR is below comparable listings
- Your manager does not provide clear benchmarking
- You have never compared performance across submarkets
What This Means:
Most owners do not realize they are underperforming until they see real comparisons.
Get Your Park City Revenue Gap Analysis
Why Underperformance in Park City Comes Down to Execution
The average Park City vacation rental underperforms by 20 to 40 percent compared to top performing properties in the same submarket.
This is not a demand issue. It is a strategy issue.
Primary causes include:
- Static pricing instead of dynamic yield management
- No submarket specific positioning
- Weak listing optimization
- Limited distribution across booking channels
What This Means:
Revenue differences in Park City are driven by strategy, not location alone.
Your Property Is Likely Underperforming If
If you answer yes to two or more of the following, your rental is likely underperforming:
- Occupancy below 60 percent during ski season
- ADR below comparable listings
- Revenue has remained flat year over year
- No pricing tied to events like Sundance
- No performance benchmarking
Bottom Line:
Underperformance is measurable and usually visible through a few key signals.
See My Property's Real Performance
Park City Rental Income Benchmarks by Submarket
Top performing rentals consistently outperform average properties across ADR, occupancy, and total revenue.
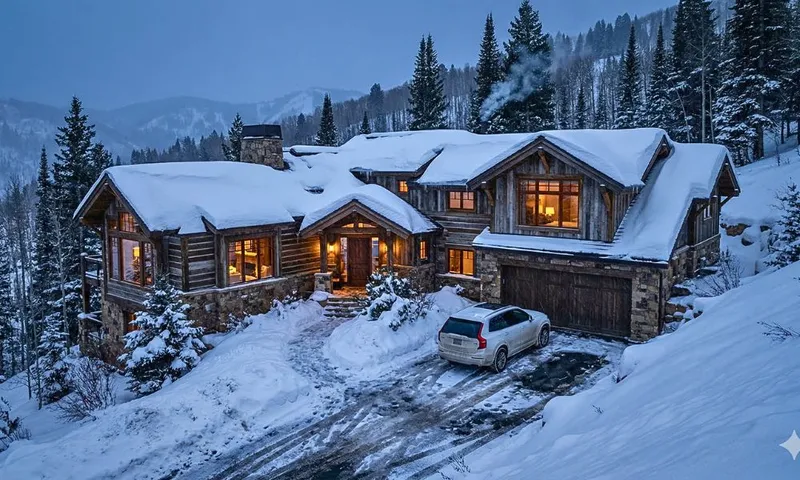
Deer Valley
- Annual income: 250K to 800K or more
- Occupancy: 55 to 70 percent
- ADR: 1200 to 3500 or more

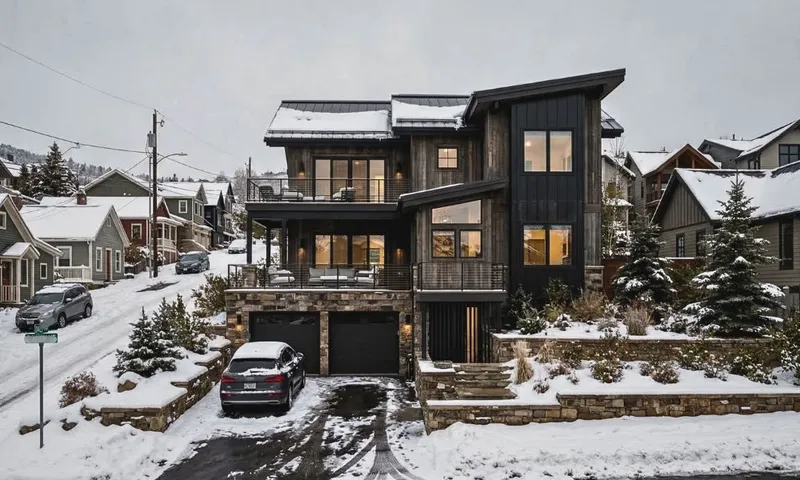
Old Town Park City
See how Old Town Park City Airbnb income compares.
- Annual income: 120K to 350K
- Occupancy: 65 to 80 percent
- ADR: 500 to 1200
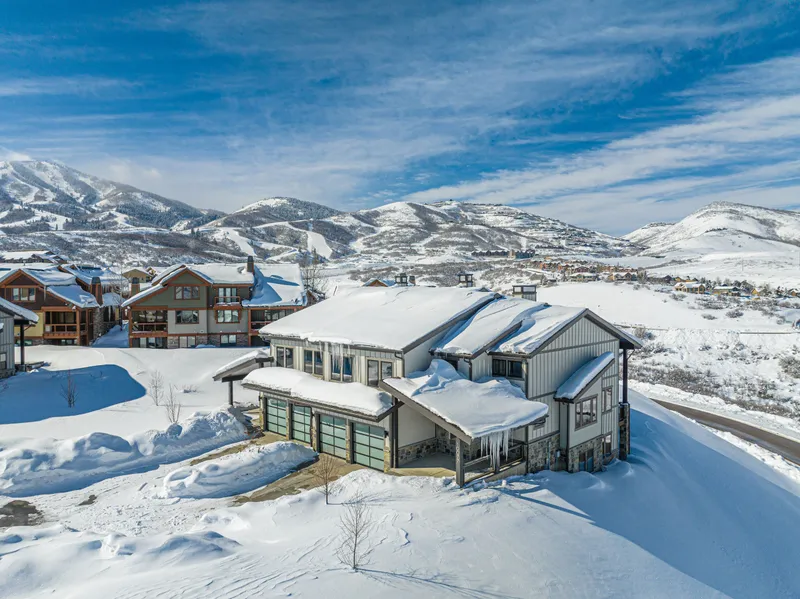
Canyons Village
- Annual income: 90K to 250K
- Occupancy: 60 to 75 percent
- ADR: 400 to 900

Jordanelle and Deer Valley East
- Annual income: 80K to 220K
- Occupancy: 55 to 70 percent
- ADR: 350 to 800
Bottom Line:
Most owners fall in the lower half of these ranges, while top operators capture significantly more revenue.
Which Park City Area Generates the Most Rental Income
- Deer Valley produces the highest total revenue
- Old Town offers the best balance of occupancy and pricing
- Canyons Village delivers consistent occupancy
- Jordanelle offers long term upside as inventory expands
What This Means:
Deer Valley leads in revenue, while Jordanelle presents the most growth potential.
Where the Biggest Revenue Gaps Actually Occur
Revenue gaps are largest when properties are managed using the wrong strategy for their submarket.
Deer Valley
- Common issue: underpricing luxury demand
- Missed revenue: 100K to 300K or more annually
Old Town
- Common issue: poor event pricing
- Missed revenue: 40K to 120K
Canyons Village
- Common issue: weak differentiation
- Missed revenue: 30K to 100K
Jordanelle
- Common issue: early stage pricing mistakes
- Missed revenue: 50K to 150K
What This Means:
The largest revenue gaps come from strategy misalignment, not demand.
Why Most Property Managers Never Show You This
Most Park City property managers do not provide true performance transparency.
Common patterns include:
- No benchmarking against comparable properties
- Reactive or flat pricing strategies
- Focus on service instead of revenue
- Limited proactive optimization
The Reality:
If you have not seen clear performance data, you are likely not being shown the full picture.
This Gap Does Not Fix Itself
Underperformance in Park City does not correct over time.
It persists because:
- Pricing remains static
- Positioning does not evolve
- No benchmarking is applied
Bottom Line:
Without changes, the revenue gap continues year after year.
Breaking Down the 20 to 40 Percent Revenue Gap
The revenue gap comes from four primary areas:
- Pricing strategy: 10 to 20 percent impact
- Listing optimization: 5 to 10 percent
- Channel distribution: 5 to 10 percent
- Guest experience and reviews: 5 to 10 percent
What This Means:
Small improvements across multiple areas compound into significant revenue gains.
Find Out Exactly How Much You Are Leaving on the Table
If your property is underperforming, the gap can be measured.
You will receive:
- A submarket specific benchmark comparison
- ADR, occupancy, and revenue gap analysis
- A clear estimate of missed income
- No obligation
- Delivered within 24 hours
- Built specifically for Park City homeowners
Get Your Park City Revenue Gap Analysis
Frequently Asked Questions
How do I know if my Park City rental income is below market
Compare your ADR, occupancy, and annual revenue to submarket benchmarks. Most underperforming properties fall 20 to 40 percent below top performers.
What is the average Park City vacation rental income
- Deer Valley: 250K to 600K or more
- Old Town: 120K to 250K
- Canyons Village: 70K to 150K
Why is my vacation rental not making more money
Most cases come down to pricing, visibility, and strategy misalignment.
Does property management impact revenue
Yes. Execution across pricing, marketing, and operations can create a 20 to 40 percent difference in revenue.
Which area performs best
- Deer Valley: highest revenue
- Old Town: strongest balance
- Canyons Village: consistent occupancy
- Jordanelle: emerging opportunity
Explore More Park City Rental Insights
- Park City vacation rental income benchmarks
- Deer Valley rental income guide
- Old Town Park City Airbnb income
- Canyons Village rental performance
The Bottom Line
Most Park City vacation rentals underperform by 20 to 40 percent due to execution gaps, not market conditions.
The difference between average and top performing properties typically ranges from 50K to 300K per year.
This gap is measurable and correctable with the right strategy.